TrainsRunner results
For each simulation, the following results are provided in chart form:
- voltage, current and sub-station power vs. time
- Substation feeders current vs. time,
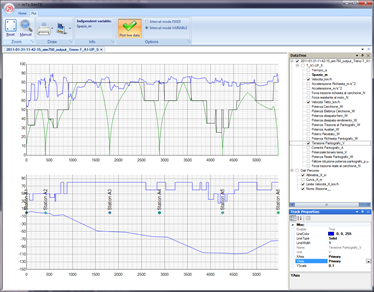
- train speed, acceleration, traction effort, braking effort, electrical braking effort, pantograph voltage, pantograph current, pantograph power, rail potential vs. time or space,
- minimum and maximum pantograph voltage vs. line position,
- minimum and maximum rail potential vs. line position,
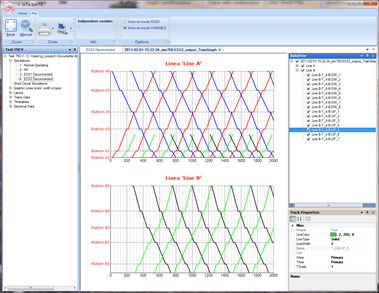
- graph of the timetable.
The following tabular data are provided for each train:
- run space and commercial speed,
- specific energy consumption (kWh, kWh / km, kWh / km / t),
- the average speed, time of travel and energy consumption between stops,
- the minimum voltage at the pantograph and its position,
- the maximum potential of the track and its position.
The following tabular data are provided for each electrical substation:
- average, minimum and maximum values of the voltage in each node,
- average, RMS and maximum values of substation current,
- average, RMS and maximum values of substation power, delivered and regenerated,
- average, RMS and maximum values of current in each substation feeder, branch and breaker.
The following tabular data are provided for the whole power supply system:
- system specific energy consumption (kWh, kWh/km, kWh/km/t)
- system Regenerability and Receptivity
- detailed report of energy consumptions and energy losses, both at system level and at single equipment/branch level.
- distributions of pantograph voltage and rail potential along the lines,
- average, minimum and maximum value of the voltage in each network node,
- average, RMS and maximum values of each network branch and breaker.